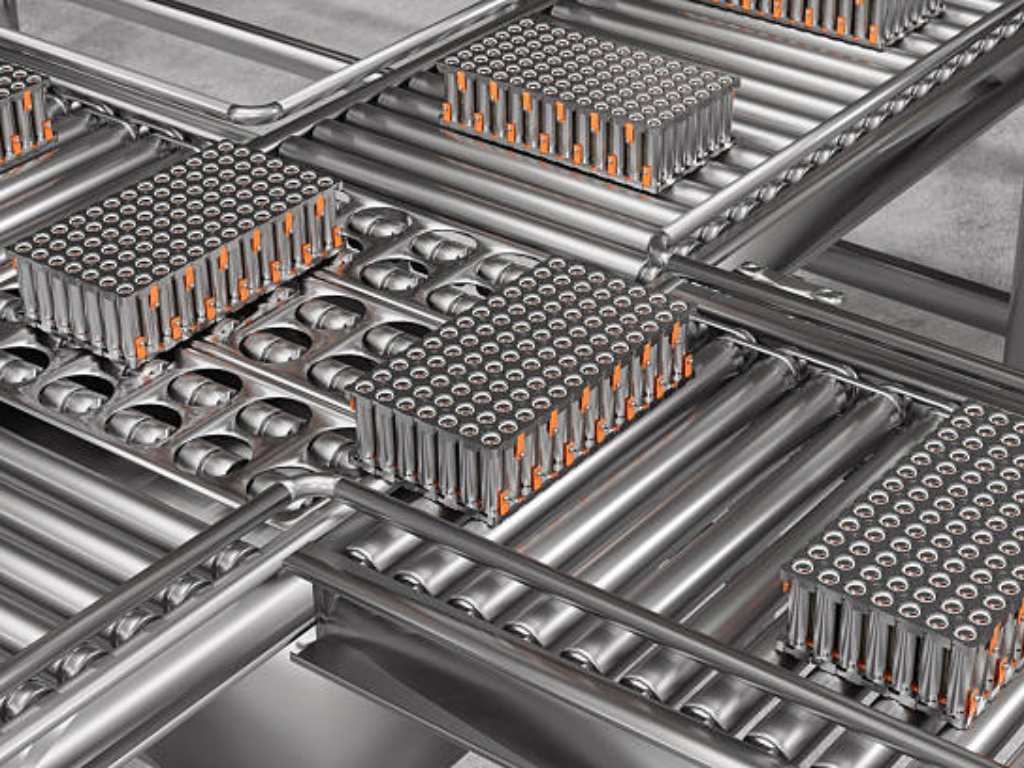
Walk into any modern battery factory and the first thing you notice isn’t the robots. It’s the relentless pace. A lithium-ion cell moves from raw material to finished product across four tightly coupled stages, each demanding a different kind of automation.
The journey starts with electrode manufacturing, where active material powders are mixed into a slurry, coated onto metal foil at 30 to 80 meters per minute, dried, calendered, and slit to width. The automation challenge here is deceptively simple: keep the slurry viscosity consistent. A 3% drift in viscosity produces uneven coating, and uneven coating is the kind of defect no downstream robot can fix.
Next comes cell assembly winding or stacking electrodes, inserting them into casings, welding terminals, and filling electrolyte. This is where speed and precision collide. A prismatic cell winder operates at 1.5 to 2.5 seconds per unit. Cylindrical lines, like those at EVE Energy’s lighthouse factory push 300 cells per minute (EVE Energy, 2026). At these velocities, a positional error of half a millimeter becomes a recall waiting to happen.
The third stage formation and aging is the industry’s quiet bottleneck. Cells undergo their first charge-discharge cycle and then sit for 24 to 72 hours while their electrochemical properties stabilize. This single stage consumes over 40% of total production line time. The automation is less about speed here and more about precision: temperature control within ±0.5°C, voltage monitoring at millivolt resolution, and data logging that creates each cell’s permanent birth certificate.
Finally, module and pack assembly brings cells together stacking, welding busbars, integrating thermal management, and marrying them to the battery management system. Multi-station coordination becomes the dominant automation problem. A pack line might have 15 robots working simultaneously; if one drifts out of sync, the entire station cascades.
Between these four stages flows a less-discussed river: material handling, data handoffs, and the fluid systems that feed each process. More on that shortly.

Core Automation Technologies Powering Modern Battery Plants
Strip a battery gigafactory down to its control architecture, and three layers emerge. The decision layer runs on AI. The execution layer is robotics. The validation layer is digital twins. Each matters, but conflating them is how automation strategies go wrong.
AI and Machine Learning: The Decision Layer
AI in battery manufacturing has moved past the pilot project phase. Real production lines now run closed-loop AI optimization on processes where human operators simply cannot react fast enough.
The clearest example comes from electrolyte filling. LEAD Intelligent’s LEADACE platform deployed at a top-tier battery manufacturer uses real-time sensor data to continuously adjust fill parameters. The result: 47 fewer non-conforming cells per machine per day, with yield improvements of 0.1% to 2.5% depending on whether the equipment is new or legacy (LEAD Intelligent, 2025). On older lines, that 2.5% gain translates to millions of additional good cells per year.
AI-powered visual inspection is equally transformative. EVE Energy’s lighthouse factory runs 100% AI vision inspection at 0.3 seconds per cell with zero missed judgments and a 70% improvement in voltage consistency compared to pre-AI benchmarks (EVE Energy, 2026). Compare that to the industry norm of sampling-based manual inspection, and the gap is hard to ignore.
In a 40 GWh gigafactory, a 1% yield improvement can be worth several million dollars annually. AI-driven predictive maintenance alone delivers 7% equipment uptime and 10% scrap reduction together worth approximately $30 million per year at that scale.
Siemens, Battery Smart Manufacturing Benchmark, 2025
Robotics and Automated Material Handling: The Execution Layer
Battery manufacturing robots are precise in ways that redefine what “acceptable” means on a production line. ABB’s IRB 4600 industrial robots, widely deployed in cell handling and module assembly, achieve cycle times roughly 25% faster than the industry benchmark for comparable payloads.
But the real automation story in battery plants is not about individual robot specs. It is about coordination. A single cell assembly station might integrate six-axis industrial robots for laser welding at positioning accuracy under ±0.3 mm, collaborative robots for connector insertion with 12-second cycle times and force-controlled feedback, autonomous mobile robots for material delivery, and linear high-speed motion systems pushing 5 meters per second for cell sorting.
When all of these operate on independent controllers with no unified scheduler, the result is noise, not a symphony. The MES layer that orchestrates this fleet often makes the difference between a line that runs at 95% OEE and one that limps at 75%.
Digital Twins and Virtual Commissioning: The Validation Layer
If one technology has gone from “interesting concept” to “competitive necessity” in battery manufacturing over the past two years, it is the digital twin.
A digital twin is a live virtual replica of a physical production line, fed by real-time sensor data. Its first payoff comes in virtual commissioning simulating the entire line design before a single piece of equipment is bolted to the floor. Siemens reports that a Taiwanese LFP manufacturer using plant simulation reduced equipment idle time by 15% and energy consumption by 5% before physical ramp-up even began (Siemens, 2025).
The second payoff is in ongoing operations. A digital twin running in parallel with the physical line can detect anomalies before they become defects predicting a welding electrode degradation trend and flagging it for maintenance rather than discovering it through a batch of scrapped cells. Typical ROI on digital twin investment lands between 12 and 24 months, scaling with line complexity.
The Hidden Foundation: Fluid Control Infrastructure in Battery Plants
If your battery line’s robots position to 0.1 mm but your slurry valve aperture fluctuates by 5%, your yield ceiling is set by the 5%, not the 0.1 mm. This imbalance is the central blind spot in most automation strategies.
The industry’s automation conversation is dominated by robots, AI, and digital twins because those technologies are visible, marketable, and intellectually satisfying. But every battery manufacturing process depends on precisely controlled fluid systems. Slurry flows. Electrolyte dispenses. Coolant circulates. Compressed air actuates. Nitrogen purges. And at the heart of every one of those flows sits a valve.
Electrode Slurry Control: Where Battery Quality Begins
Electrode slurry is a non-Newtonian fluid with viscosity ranging from 2,000 to 10,000 mPa·s, carrying solid particles of active material and conductive additive at D50 particle sizes of 5 to 10 micrometers. It is abrasive. It settles. And it must reach the coating head at a flow rate stable enough to maintain coating weight consistency within ±1.5% the industry’s pass/fail line, with advanced lines targeting ±1.0%.
The valves controlling this flow need three things: corrosion-resistant internals in PTFE-lined or duplex stainless steel, tight shutoff to ANSI Class VI zero-leakage, and operation that does not shed metal particles into the slurry. A single leaking valve in the supply line does not just waste material. It introduces flow pulsation that propagates directly into coating thickness variation, and from there into cell-to-cell capacity inconsistency that the formation stage cannot correct.
The automation integration is straightforward in principle: an electric actuator on the control valve, a magnetic flow meter providing feedback, and a PID loop adjusting valve position to maintain target flow. The hard part is getting the components right, particularly the valve’s deadband and response time, which determine whether the control loop can track the setpoint at coating speeds of 30 to 80 meters per minute.
Electrolyte Filling Precision: The Milliliter-Controlled Critical Step
If slurry control determines electrode quality, electrolyte filling determines cell safety and lifespan. Lithium hexafluorophosphate electrolyte is moisture-sensitive to an extreme degree exposure to ambient air at levels above 10 parts per million water content triggers irreversible degradation. The filling environment requires a dew point below -40°C, and every valve in the fluid path must resist LiPF6 corrosion while delivering fill accuracy of ±1.0% by volume.
The filling process is multi-stage: vacuum draw-down to evacuate air from the electrode pores, slow injection to allow capillary wetting, pressurized hold to force electrolyte into the deepest layers, and a final level check. Each stage has its own valve opening profile, and the transition between stages often just milliseconds is where precision is won or lost. Micro-metering valves with PTFE or Hastelloy wetted parts, driven by electric actuators with sub-degree positioning resolution, are the standard for high-end lines pushing toward ±0.5% fill accuracy.
Cooling, Gas, and Utility Systems: The Unsung Automation Enablers
A battery factory’s utility systems are its circulatory and respiratory systems. The formation department generates enormous heat every cell being charged is effectively a small heater and cooling water must reach ±0.5°C precision across hundreds of channels simultaneously. Each channel is controlled by an electric modulating valve responding to a temperature sensor feedback loop. One stuck-open valve floods a formation cabinet with overcooled water, and suddenly an entire batch develops capacity spread that only shows up weeks later at the end-of-line tester.
Compressed air systems, typically specified to ISO 8573-1 Class 1 for particle and moisture content, power pneumatic actuators across the entire plant. A pressure fluctuation of ±0.1 bar at the compressor discharge, easily caused by a failing pressure regulator, ripples through every pneumatic device downstream. And in the welding stations, nitrogen shielding gas at 99.999% purity flows through high-seal valves where any leak compromises weld integrity, not just wastes gas.
These systems rarely appear in automation strategy documents. Yet a single utility valve failure can idle a production line as effectively as a robot arm collision. The difference: everyone watches the robots. Almost nobody audits the valves. Not until something fails.
Pre-Flight Fluid System Audit
Slurry Delivery Is Your Valve Particle-Shedding-Free?
Check that all slurry-line valves use PTFE-lined or duplex stainless internals rated to ANSI Class VI. Metal particle contamination from valve wear is the #1 underestimated defect source.
Electrolyte Metering ±1.0% Fill Accuracy or Better?
Verify micro-metering valves deliver ±1.0% volume accuracy across all channels. LiPF6 corrosion resistance (PTFE/Hastelloy wetted parts) is non-negotiable in the filling environment.
Cooling & Gas Systems Automated Control With Feedback Loops?
Cooling water should hold ±0.5°C per channel via electric modulating valves. Compressed air at ISO 8573-1 Class 1, N‚ at 99.999% purity both need high-seal automated valves with pressure monitoring.
From Lab to Gigafactory: Solving Automation’s Toughest Challenges
Understanding the technology is one thing. Deploying it at scale is another. Three interconnected challenges define the gap between what works in a pilot line and what survives in a gigafactory.
The yield cliff. A battery process that delivers 95% yield in the laboratory routinely produces 40% yield during initial production ramp-up (Siemens, 2025). The culprit is not any single process. It is the compounding effect of small variations when production speed increases by 10 to 100 times. Grob-Werke’s engineers have done the math: if your electrode line produces one defective sheet per 10,000, and each cell uses 100 sheets, and each pack uses 30 cells, that single defect cascades into a 25% pack scrap rate (eMobility Engineering, 2026). The industry’s semiconductor cousins operate at 96-98% yield. Battery manufacturing, even among established players, sits closer to 90% in steady state.
Contamination at sixteen points. Industry experts at Meech International have mapped 16 discrete contamination points across a typical battery production line. Metallic particles shed from equipment wear surfaces rank as the most underestimated threat. In a dry room with a -40°C dew point, the automation equipment itself must not become a contamination source. This constraint shapes component selection directly: bearings, seals, and valve internals all need materials that do not generate particles under repeated cycling.
Data that cannot travel. Walk through most battery plants and you will find a digital Tower of Babel. Japanese winding machines, German coating lines, and Chinese formation cabinets each speak their own protocol. The data exists gigabytes of it, generated every hour but it cannot flow across process boundaries to enable the root-cause analysis that would actually improve yield. Rockwell Automation and Siemens have both identified this as the single largest barrier to closed-loop optimization in battery manufacturing. It is at least as much an organizational problem as a technical one.
What ties these three challenges together is a common thread: they all point back to infrastructure quality. The yield cliff narrows when upstream processes, particularly slurry preparation and electrolyte filling, operate with higher consistency. Contamination is fundamentally a materials and component selection problem. And data integration, while partly a software challenge, begins with having instruments and actuators that generate clean, structured data, including smart valves and actuators with embedded diagnostics.
The Yield Cliff
Lab 95% drops to 40% at ramp-up. One electrode defect per 10,000 sheets cascades into 25% pack scrap. Upstream process consistency is the only real fix.
Contamination
16 contamination points mapped across the line. Metal particles from equipment wear surfaces are the #1 hidden threat. Materials selection IS contamination control.
Data Silos
Different equipment speaks different protocols. Gigabytes of quality data sit trapped at process boundaries. Root-cause analysis starts with one bridge, not a full platform.
A Practical Roadmap: Assessing Your Battery Plant’s Automation Readiness
The previous sections laid out what battery manufacturing automation looks like in 2026. Here is how to apply it to your own operation, whether you run a 40 GWh gigafactory or a 2 GWh specialty line.
Step 1: Map Your Fluid Infrastructure First. Before you invest in another AI pilot, walk your line and answer three questions. Are your slurry delivery valves corrosion-resistant and free of particle shedding? Does your electrolyte filling system hold ±1% volume accuracy across all channels? Do your cooling water circuits have automated temperature control with functional feedback loops? If you answered “I’m not sure” to any of these, you have found your highest-ROI automation project. And it is not a robot.
Step 2: Audit Your Data Architecture. Count how many different communication protocols exist on your line. More than three means your data integration problem is real. Identify the most critical quality data that currently stops at a process boundary typically formation data that never reaches the electrode team and build one bridge before trying to connect everything.
Step 3: Identify Your Actual Bottleneck. Do not default to the newest, most complex process station. The bottleneck in most battery plants is not the laser welder or the stacker. It is an aging coating line, an inconsistent filling station, or a formation cabinet with temperature drift. Find the station with the widest Cpk spread, not the one with the most impressive spec sheet.
Step 4: Build a Phased Automation Plan. Phase one, months 0 to 6, targets critical station-level automation and basic data collection, moving yield from 40% to 70%. Phase two, months 6 to 12, adds line-level MES and online inspection, pushing from 70% to 85%. Phase three, months 12 to 24, introduces AI-driven closed-loop optimization and full lifecycle traceability, targeting 95% and above. These targets are based on Siemens’ battery manufacturing benchmarks and are achievable with disciplined execution.
Audit slurry valves, electrolyte metering, and cooling controls. Find your highest-ROI project it’s rarely a robot.
More than 3 protocols on your line? Build one cross-boundary bridge start with formation data reaching the electrode team.
Not the laser welder. Find the aging coater, inconsistent filler, or drifting formation cabinet with the widest Cpk spread.
0 6 mo: 40% to 70% yield. 6 12 mo: MES + inspection to 85%. 12 24 mo: AI closed-loop to 95%+.
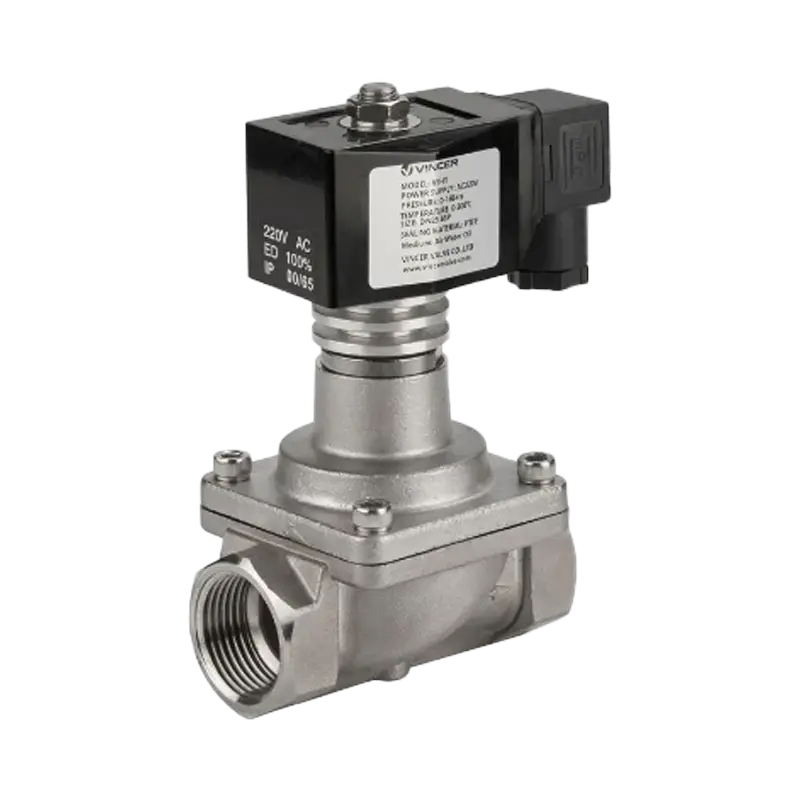
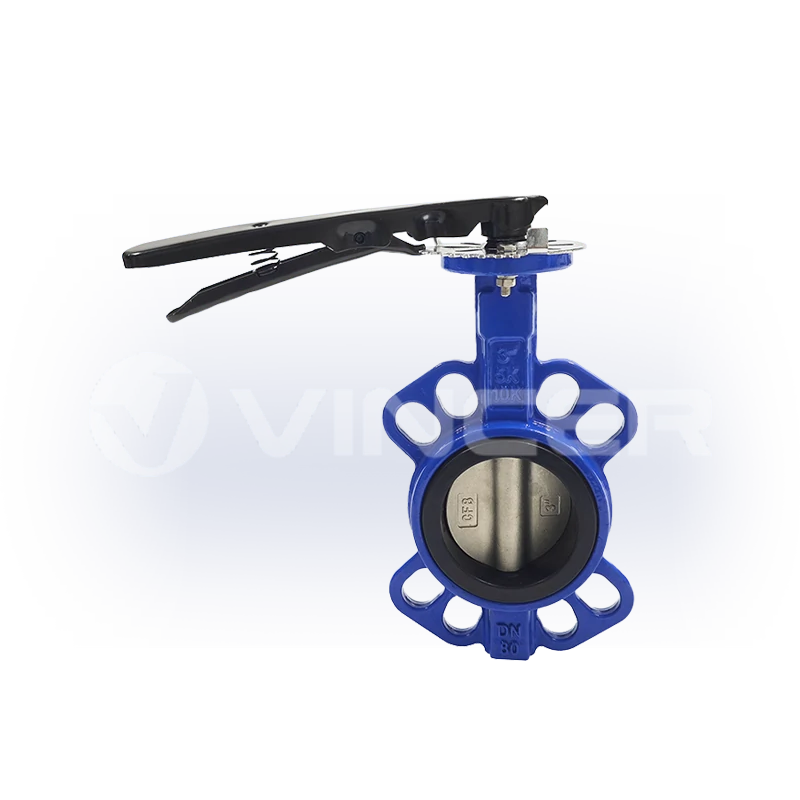
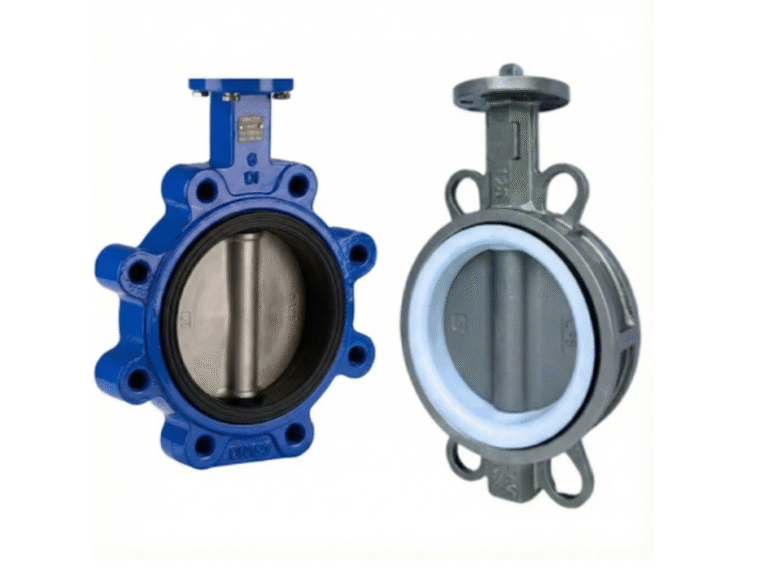
When evaluating automation infrastructure for battery production, pay particular attention to the fluid control components that underpin every process stage. The difference between a production line that consistently hits its yield targets and one that doesn’t often traces back to the quality of valves and actuators managing slurry, electrolyte, coolant, and gas flows. Manufacturers like VINCER whose electric actuated valves and globe control valves are built for the precision demands of automated industrial fluid systems offer a useful reference point for what properly specified process control hardware looks like in practice. Getting the valves right will not make headlines the way AI does. But it will keep your line running while your competitors are still chasing yield gremlins.
Talk to a Valve Engineer About Your Battery Line
Get a technical consultation on fluid control specifications for battery manufacturing response within 12 hours.
Request ConsultationReferences
- EVE Energy. “World’s First Cylindrical Battery Lighthouse Factory.” 2026. evebattery.com
- LEAD Intelligent. “LEADACE Intelligent Platform Boosts Quality and Efficiency for Electrolyte Filling.” 2025. leadintelligent.com
- Siemens. “Battery Smart Manufacturing: Turning Data Into Decisions at Every Stage of Production.” 2025. blog.siemens.com
- eMobility Engineering. “Battery Manufacturing Scale-Up: Quality, Yield and Efficiency.” 2026. emobility-engineering.com
- VINCER Valve. “Electric Actuated Valves.” vincervalve.com
- VINCER Valve. “Globe Control Valves.” vincervalve.com
- VINCER Valve. Homepage. vincervalve.com